Candlestick patterns are one of the most widely used tools for spotting potential reversals in price action. Among these, the Kicker pattern stands out as one of the most powerful two-candle reversal signals a trader can find on a chart. In this article, we’ll break down what Bullish and Bearish Kicker patterns are, explore their three variations, and explain why some versions of this pattern are far more reliable than others. Below are the highlights of this article that we will discuss throughout.
- Kicker patterns are powerful two-candle reversal signals driven by a sudden shift in market sentiment.
- Type 1, which displays a gap beyond the previous candle’s open, is the most reliable, as it shows zero overlap between the candles.
- Type 2, which displays a gap right at the previous candle’s open, is moderately reliable.
- Type 3, which displays a gap within the previous candle’s body, is the least reliable, due to partial overlap.
What Is a Kicker Pattern?
A Kicker pattern is a two-candlestick formation that signals a sudden and forceful shift in market sentiment. It occurs when a candle in one direction is immediately followed by a candle that gaps sharply in the opposite direction, effectively “kicking” the price away from its prior trend.
- A Bullish Kicker forms when a bearish (down) candle is followed by a candle that gaps up and closes strongly bullish, signalling that buyers have overwhelmed sellers.
- A Bearish Kicker forms when a bullish (up) candle is followed by a candle that gaps down and closes strongly bearish, signalling that sellers have overwhelmed buyers.
What makes the Kicker pattern unique is the gap between the two candles. This gap represents a sudden change in how the market values the asset, often driven by unexpected news, earnings surprises, or a sharp shift in trader psychology.
The Three Types of Kicker Patterns
Not all Kicker patterns are created equal. The reliability of the signal largely depends on where the second candle opens relative to the first candle. Based on this, Kicker patterns can be classified into three types.
Type 1: Gap Beyond the Previous Candle’s Open (Most Reliable)
In this variation, the second candle opens above or below the previous candle’s open, meaning the entire body of the first candle is left behind by the gap. There is no overlap whatsoever between the two candles.
- Bullish version: The second candle opens above the high of the first candle’s open, leaving a clean gap.
- Bearish version: The second candle opens below the low of the first candle’s open, leaving a clean gap.
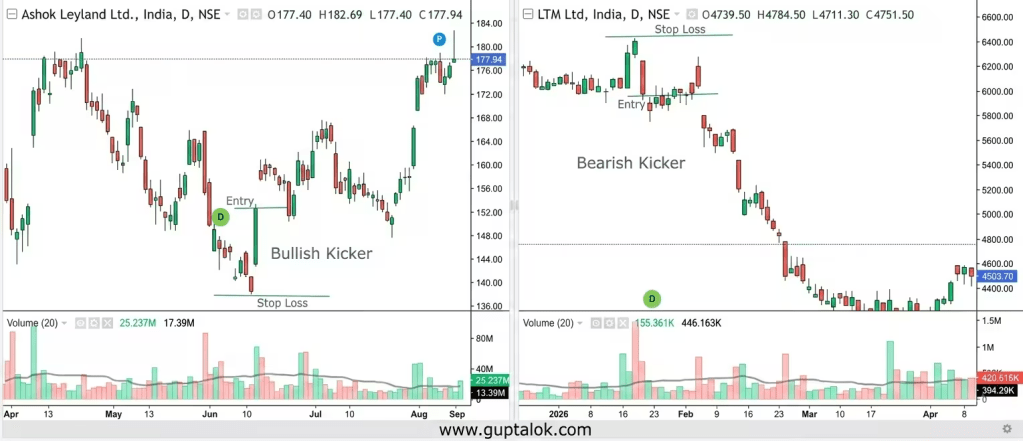
Type 1 - Highly Reliable Bullish and Bearish Kicker FormationsThis is the textbook, “purest” form of the Kicker pattern. Because there is a complete gap with zero overlap, it reflects a decisive and abrupt change in sentiment. This is why this variation is considered the most reliable of the three.
Type 2: Gap Right at the Previous Candle’s Open
Here, the second candle opens exactly at the previous candle’s open price. There’s still a gap relative to the prior candle’s close, but the opening price coincides precisely with where the first candle began.
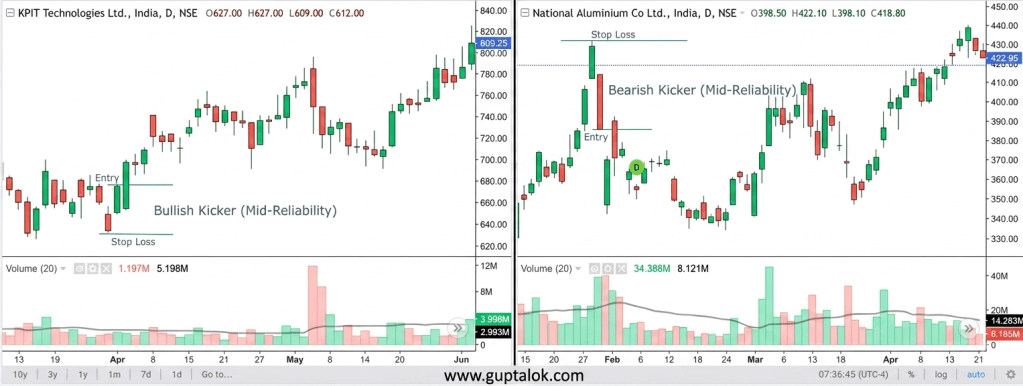
Type 2 - Moderately Reliable Bullish and Bearish Kicker FormationsThis version still carries meaningful weight because the entire body of the previous candle has essentially been “erased” by the new candle’s open. However, since there’s no true separation between the two candle bodies, it’s considered moderately reliable — a notch below the first type, but still a strong signal.
Type 3: Gap within the Body of the Previous Candle (Least Reliable)
In this variation, the second candle gaps in the opposite direction but opens within the body of the previous candle, rather than beyond its open. This means there’s partial overlap between the two candles.
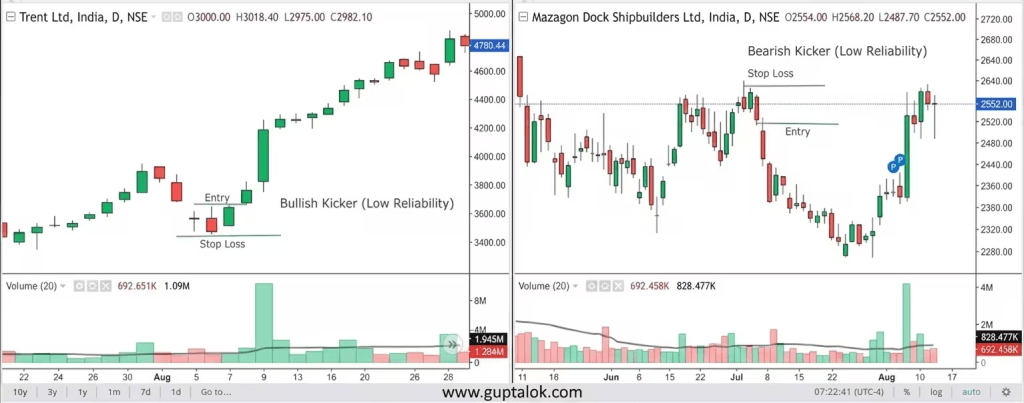
Type 3 - Least Reliable Bullish and Bearish Kicker FormationsBecause the second candle fails to fully overshoot the first candle’s body, this version reflects a weaker and less decisive shift in sentiment. Some analysts argue this shouldn’t even be classified as a “true” Kicker due to the overlap, but it is still a milder version of the same underlying signal. It is the least reliable of the three types and should be treated with more caution.
Points to Remember while trading Kicker Patterns
Kicker patterns are undoubtedly great for catching a good trade — but that only happens when you identify them correctly. Here are a few things to watch for while trading kickers:
- Both candles of the kicker should have solid bodies, ideally resembling a Marubozu — especially the second candle.
- Avoid trading kicker patterns that form large wicks in the direction you anticipate the price to move.
- A kicker that reverses the price after several trending candles is more reliable to trade than one that reverses the direction after just a single candle.
Why the Gap Matters
The size and location of the gap directly reflect the intensity of the sentiment shift. A full gap (Type 1) shows that not a single trader was willing to transact anywhere near the previous candle’s range — a sign of overwhelming conviction. A partial gap (Type 3), on the other hand, shows that some trading activity still occurred within the previous candle’s territory, suggesting the reversal in sentiment, while present, wasn’t as forceful.
Don’t Ignore Volume
While the gap tells you how sharp the sentiment shift was, volume tells you how much conviction is behind it. A Kicker pattern — regardless of its type — should always be examined alongside the volume of the second candle.
High volume on the second candle confirms strong participation and adds credibility to the reversal signal, even for a Type 2 or Type 3 pattern.
Low volume on the second candle raises doubts about the pattern’s strength, even if it’s a “textbook” Type 1 formation. A gap with weak volume may be more prone to getting filled or reversed in subsequent sessions.
In short, volume acts as a confirmation layer. A Type 1 Kicker with strong volume is about as reliable a reversal signal as you’ll find on a candlestick chart. Conversely, any Kicker pattern with unusually thin volume should be approached with extra caution, regardless of how clean the gap looks.
Always Use a Stop Loss
No matter how cleanly a Kicker pattern forms, or how strong the volume looks, one rule should never be skipped: always trade this pattern with a stop loss.
The stock market doesn’t guarantee outcomes, even for well-formed, textbook patterns. A Type 1 Kicker with a full gap and heavy volume can still turn out to be a false signal, with price reversing right back in the opposite direction — against the very trade you entered. This can happen due to sudden news flow, broader market weakness, large institutional orders, or simply a lack of follow-through buying or selling after the initial move.
Where Should the Stop Loss Be Placed?
Different traders define the stop loss zones differently. A few traders keep it based on the second candle, while the rest keep it based on the entire pattern. Here are the most commonly used approaches, and I prefer the first one based on my trading experience.
At the overall pattern’s high/low (widest stop loss)
This approach uses the highest high or lowest low formed by either of the two candles in the pattern, rather than just the second candle alone. This is the strategy I personally prefer, as it gives the price more room to consolidate after the initial gap, without prematurely stopping out a trade that’s still developing. Below are the details of where exactly the stop loss should be placed for bullish and bearish patterns.
- Bullish Kicker: Stop loss below the lowest point of the pattern (whichever of the two candles has the lower low).
- Bearish Kicker: Stop loss above the highest point of the pattern (whichever of the two candles has the higher high).
This gives the trade the widest berth of the three approaches, allowing for some post-gap consolidation or a minor pullback without shaking you out too early, while still keeping the stop loss tied to the pattern’s actual structure.
At the second candle’s open (tighter stop loss)
Many traders consider the defining feature of a Kicker pattern as the gap itself. According to them, the moment price trades back to the second candle’s open, the gap is effectively “filled,” and the sudden shift in sentiment that created the pattern is no longer intact. They treat this as an early warning sign and exit right here, accepting a smaller loss in exchange for a quicker exit if the pattern starts to fail. Where exactly the stop loss should be placed, based on this consideration, is given below.
- Bullish Kicker: Stop loss at the open of the second (up) candle.
- Bearish Kicker: Stop loss at the open of the second (down) candle.
At the second candle’s low/high (wider stop loss)
This is a slightly more conservative approach for those who consider the second candle for stop loss. It comparatively gives the trade a bit more room to breathe. As long as price stays within the range of the strong kicker candle, the move is still considered intact. Below are the stop loss points for bullish and bearish patterns, based on this approach.
- Bullish Kicker: Stop loss below the low of the second candle.
- Bearish Kicker: Stop loss above the high of the second candle.
Below is the comparison table with Pros and Cons of each stoploss strategy.
| Stop Loss Placement | Located On | Pros | Cons |
|---|---|---|---|
| Pattern’s overall high/low | Both candles | Allows for consolidation, avoids premature stop-outs | Widest stop, larger loss if the pattern fails |
| Second candle’s open | 2nd candle | Tighter, exits faster, respects the gap as the core signal | More prone to getting stopped out by minor noise |
| Second candle’s low/high | 2nd candle | Gives the trade more room to breathe | Larger loss if the pattern fails |
Neither approach is “wrong” — it comes down to your personal risk appetite and how strong the pattern and volume look. Remember, the Kicker pattern is a probability-based signal, not a guarantee. Combining a well-formed pattern with strong volume and a disciplined stop loss is what turns a good-looking chart formation into a sound, risk-managed trade.
Conclusion
The Kicker formations are a one of the best patterns to identify a reversal trade. However, this pattern works best when combined with other technical tools such as support/resistance levels, trend indicators, and broader market context, rather than being used in isolation. If you take a trade after examining all these aspects with strict stop losses, your trading journey is most likely to be fruitful.
Frequently Asked Questions
What is a Kicker candlestick pattern?
A Kicker candlestick pattern is a two-candle reversal pattern where a candle in one direction is immediately followed by a candle that gaps sharply in the opposite direction. This gap signals a sudden, forceful shift in market sentiment, making the Kicker one of the strongest reversal signals in technical analysis.
What is the difference between a Bullish Kicker and a Bearish Kicker?
A Bullish Kicker appears when a down candle is followed by a candle that gaps up and closes firmly bullish, indicating buyers have taken control. A Bearish Kicker occurs when an up candle is followed by a candle that gaps down and closes firmly bearish, showing sellers have overwhelmed buyers.
Which type of Kicker pattern is the most reliable?
The most reliable Kicker pattern is the one where the second candle opens beyond the previous candle’s open, leaving a full gap with zero overlap between the two candle bodies. This “textbook” version reflects the most decisive and abrupt shift in sentiment.
Is a Kicker pattern with overlapping candles still valid?
A Kicker pattern where the second candle opens within the body of the first candle is still a valid but weaker signal. The partial overlap indicates a less forceful sentiment shift, making this the least reliable one.
Why is volume important when trading a Kicker pattern?
Volume confirms the strength of the sentiment shift behind a Kicker pattern. High volume on the second (kicker) candle adds credibility to the reversal, while low volume raises doubts about the pattern’s strength, even if the gap itself looks clean.
Where should I place my stop loss when trading a Kicker pattern?
The stop loss for a Kicker pattern is placed at the overall pattern’s high or low across both candles.
Is the Kicker pattern more reliable than the Engulfing pattern?
The Kicker pattern is generally considered more reliable than the Engulfing pattern because it includes a true price gap, showing no trading activity occurred within the previous candle’s range. An Engulfing pattern, by contrast, has candle bodies that overlap, reflecting a less abrupt shift in sentiment.
Can the Kicker pattern fail?
Yes. Like all candlestick patterns, a Kicker pattern can produce a false signal, with price reversing back against the direction of the pattern. This is why using a stop loss and confirming with volume is essential rather than relying on the pattern alone.
Does the Kicker pattern work on all timeframes?
Kicker patterns can appear on any timeframe, from intraday charts to daily and weekly charts, but they tend to be more significant and reliable on higher timeframes (daily and above), where gaps are less common and more likely to reflect genuine shifts in sentiment.
Should I enter a trade immediately after spotting a Kicker pattern?
Many traders wait for confirmation, such as continuation in the same direction on the next candle or sustained volume, rather than entering immediately after the second candle closes. This helps filter out false signals before committing capital. However, I personally enter the trade as soon as the kicker pattern has been formed. Remember, a complete formation means that the kicker candle has closed, not that it is still in the process of forming.





Leave a Reply