There are plenty of indicators and strategies to make the trading decisions such as VWAP, Moving Average Crossovers, Stochastic, RSI, MACD, etc. A few of these indicators are said leading indicators for showing early signs for an entry while the others are called lagging indicators which signal for an entry a little later.
You might also like: What is Intraday Trading?
The leading and lagging indicators are commonly used in combination with some other indicators to make more accurate decisions. However, combining these indicators with one or the other price-action strategy is the best way to make better trading decisions. The candlestick patterns and chart patterns are two main price-action strategies that work really well in combination with other indicators. Here, we will talk about two chart patterns that provide wonderful trading signals, and if they are combined with other indicators and strategies, they can become a great aid in your way to make money through trading.
What is a Double Top Pattern or M-Pattern ?
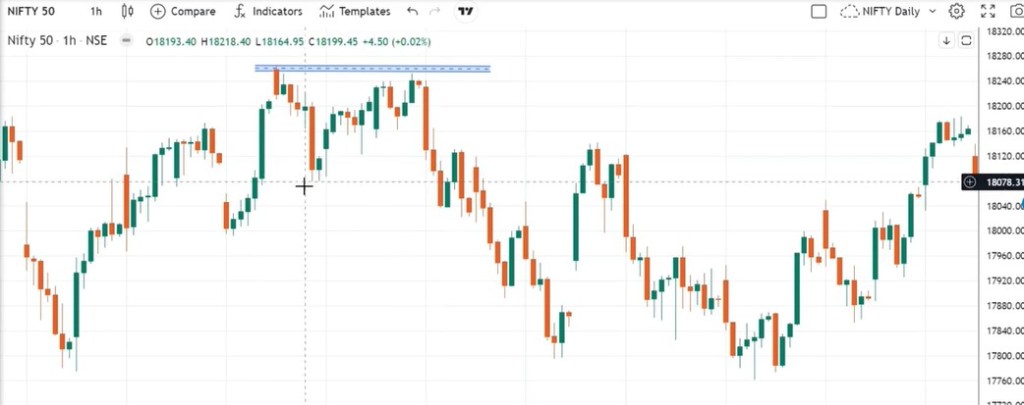
The double-top pattern is a price action strategy that can be used to identify a trade, by means of closely analyzing the price movement of a stock or any other instrument. This pattern gets formed when the price rebounds from slightly lower levels, to observe resistance at a particular high twice. In order to form this pattern, price surges to make a high, from there, it declines a bit. (See the Video Below) After that, it reattempts to surge but observes pressure from a similar high to decline again. This second decline confirms the formation of a double-top pattern that looks like an ‘M’. Therefore, it is also said M-pattern.
How to identify a Double-Top Pattern?
In order to trade this pattern, it’s best to use the line chart because that shows a clearer pattern formation. Expert traders can easily identify the pattern on the candlestick chart but it might be difficult for the novice traders, therefore they should initially use a line chart to identify the double-top pattern because that would be an easier way to identify the formation. In this, one should wait for the price to hit the previous high, and if that high is not broken out, a decline would be witnessed which would confirm the Double-top formation.

How to trade a Double Top Pattern?
While trading, if you see that the price is observing resistance at a previous high instead of breaking it, wait for a decline up to the latest low. Once the price breaks below that low and you see that the ‘M’ has been formed, enter a trade with a stop loss above both the tops and the target can be kept, perhaps, at double the stop loss points. Also, remember to change your target level based on the price movement. If the price is seen observing support, exit early. On the contrary, if free fall is visible, hold the position for better returns.
What is a Double-Bottom Pattern?
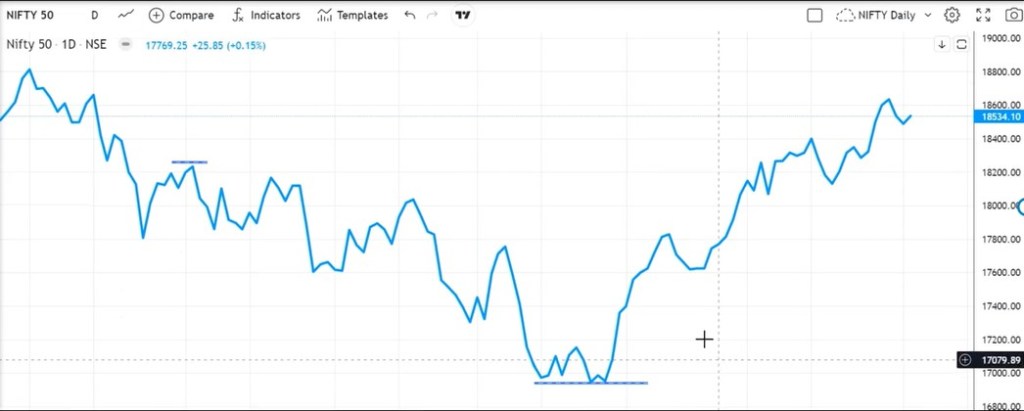
The Double bottom pattern is a pattern which shows that the price has observed support at similar lows twice. In this, the falling price takes support at a lower level to rebound a bit, but it falls again due to ongoing supply power to observe support at similar lower levels again.

When it rebounds from the lower level for the second time, it forms a W-like pattern that is called double-bottom pattern and indicates that the level of rebound is a buying zone. It gives an opportunity to enter a bullish trade. In order to trade this pattern, one should keep a close watch at the falling prices and wherever price rebounds twice from similar levels, a bullish entry should be taken.
You might also like: Understanding Positional Trading
The W-pattern should also be identified and traded in the same way as M-pattern is traded (See the Video Above). The only difference in both the patterns is that the Two-top pattern is used for bearish entry at higher levels while the double-bottom is used for bullish entry at lower levels.
Final Interpretation
The above-mentioned chart patterns are not actually two patterns but two parts of same pattern. One is just opposite to other, and therefore, one is used for bullish entry while the other for a bearish entry. Though, these chart patterns give quite accurate signals but none of the patterns provide 100% correct indication, therefore strictly follow the stop losses to keep your capital protected.