If you look at the technical chart of the Agarwal Industrial Corporation Limited, you’ll find it making morning star bullish candlestick pattern on daily time frame. Therefore, it can be bought above 1212 with a stop loss below 1104.80. Don’t forget to read our disclaimer before entering this trade. Check out the chart below:

Daily chart of AGARIND stockI also checked the fundamentals of this share which seem to be good to consider it for buying.
The other company is the ACLGATI whose stock seems to make support at current levels. I feel this stock would give a wonderful up-move from here, if the current monthly candle closes in green. If it happens, one can enter a a bullish position on this stock above the high of this candle. Check out the chart below:
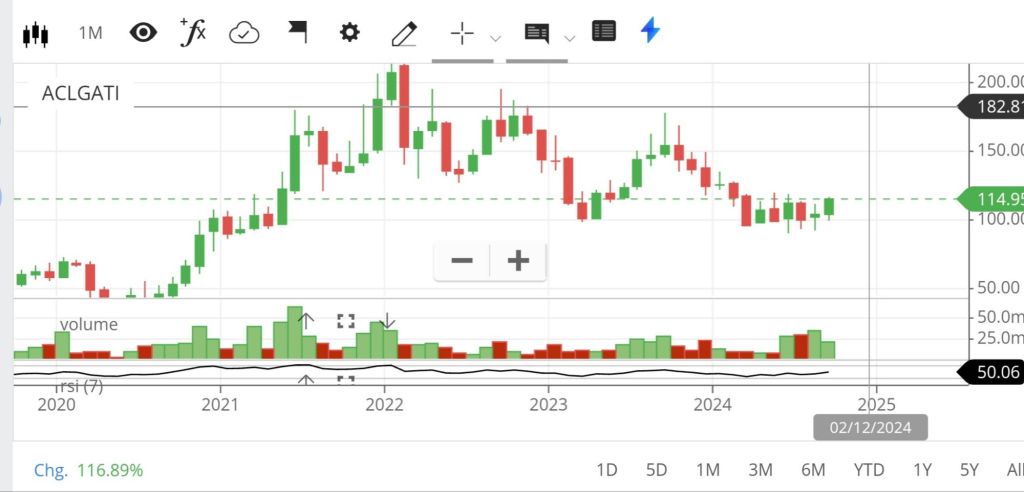
Monthly Chart of the ACLGATI stockNote: We are not SEBI registered advisors, read our disclaimer before making an entry based on this article.


Leave a comment