Nifty 50 has been showing several ups and downs, for some time. Every second day it becomes bullish and then bearish again, or vice-versa. However, if we look at the weekly chart of the index, it shows a good hammer-like candlestick pattern.

Nifty 50 weekly chart as on 18 August 2024It is bullish pattern and therefore it’s the time to enter bullish trade in NIFTY, perhaps through buying its constituents. Please read our disclaimer before moving further.
Nifty Stocks with Bullish Patterns
After looking at the positioning of the index, it is expected that it will make a good up-move from here. However, it is difficult for the traders, like me, to hold future and option contracts for long. Therefore, it’s better to buy the stocks which would participate in this rally. You can check out the list of such stocks below.
Tata Consultancy Services
TCS is the first stock in the list that makes similar pattern to the index. Many other IT stocks have made similar patterns as the they seem to be leading this rally. You can also check the chart of the IT index.

TCS weekly chart as on 18 August 2024Infy, Wipro, and HCLTech
The next stock is Infosys that also comes form the same IT sector.
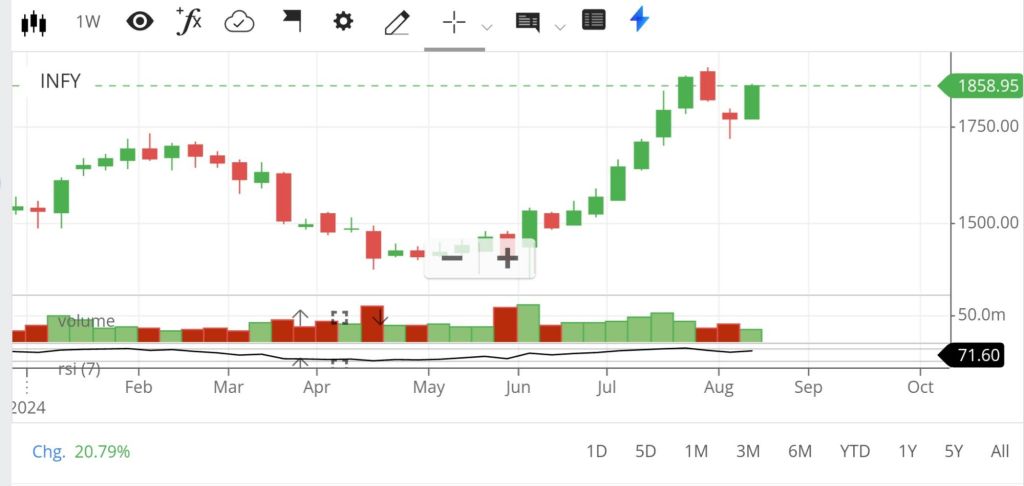
Infosys weekly chart as on 18 August 2024You can look at the weekly charts of Wipro and HCL Tech who are also making bullish candlestick patterns on their weekly charts.
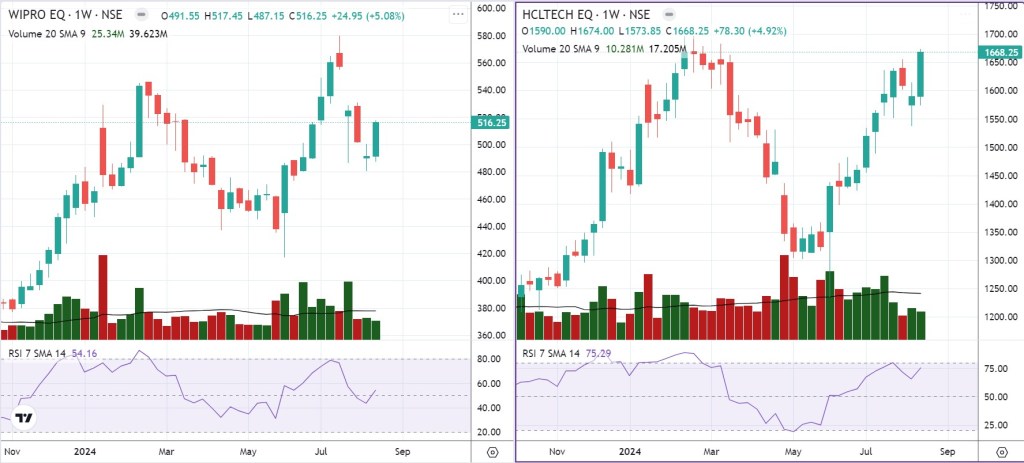
Weekly charts of Wipro and HCL Tech as on 18 August 2024Axis Bank
From the banking sector, I got only Axis Bank that has made a doji candle along with the confirmation candlestick.
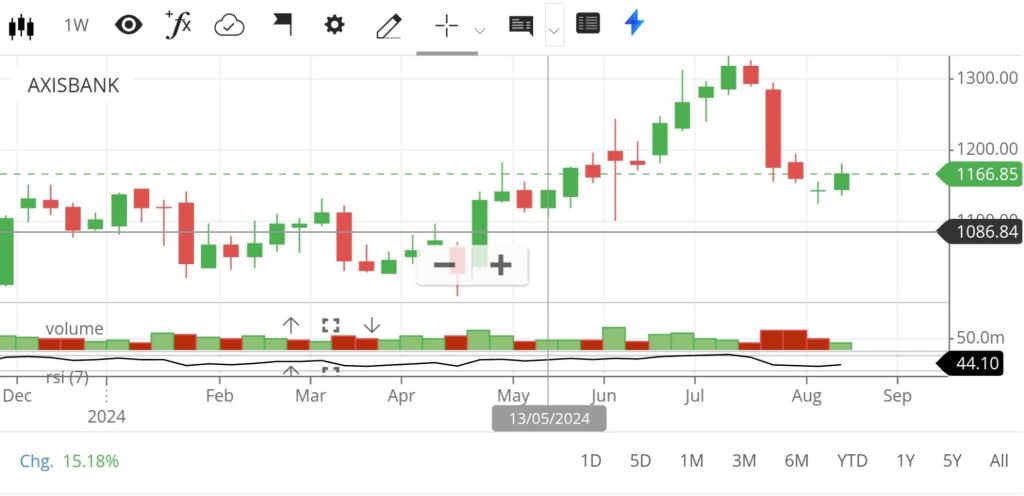
Axis Bank weekly chart as on 18 August 2024Tata Motors and M&M
Besides Banking and IT shares, an automobile company “Tata Motors” is also making a bullish candlestick pattern. It exhibits a bullish hammer candlestick pattern formation on weekly chart.
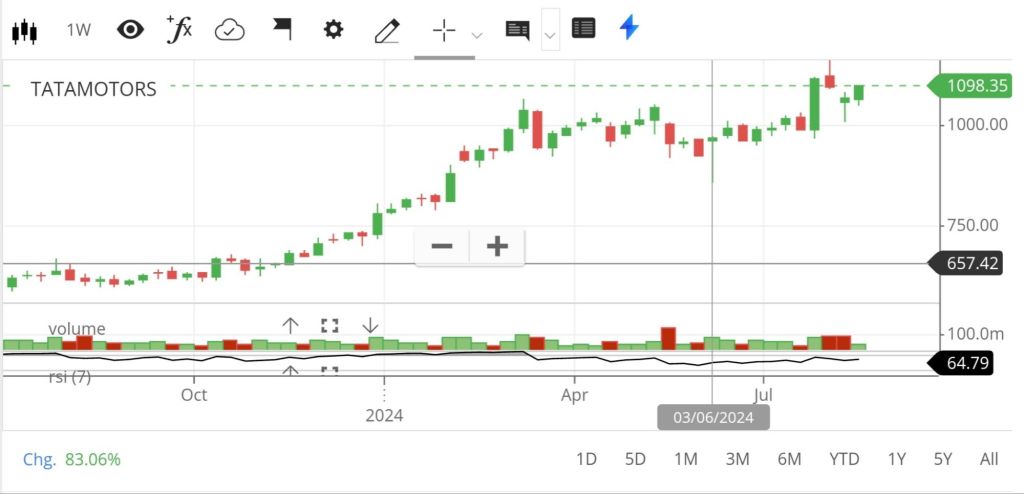
Tata Motors weekly chart as on 18 August 2024Apart from Tata Motors, M&M is also making bullish pattern albeit it hasn’t made hammer-doji candle.

M&M weekly chart as on 18 August 2024Nifty Stocks with Bearish Patterns
Though, the Nifty weekly chart has made bullish pattern, a few Nifty shares have made negative patterns too. Check them out below:
Divis Laboratory
The weekly chart of Divis Lab has made a good bearish candlestick pattern exactly at its recent top.
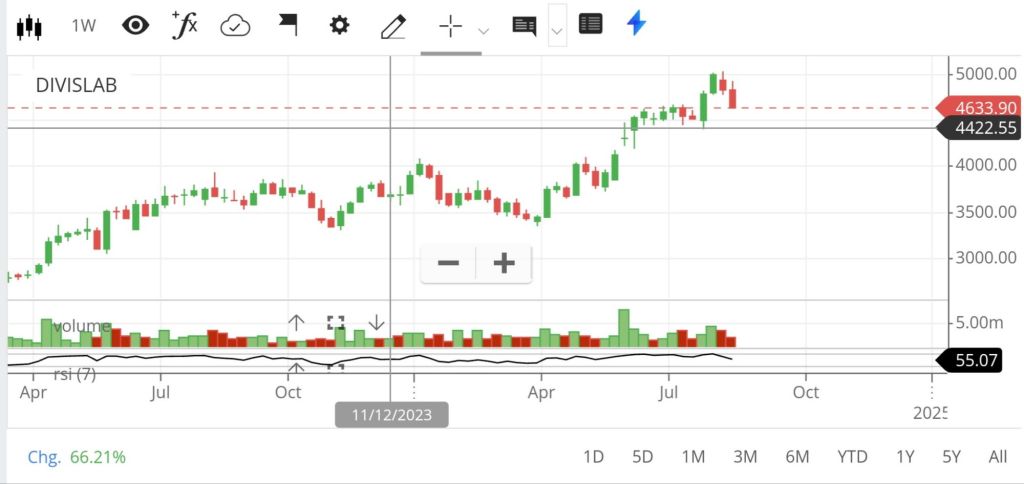
Divis Lab weekly chart as on 18 August 2024NTPC
NTPC, a government sector stock, has also made a bearish candlestick pattern on its weekly chart.
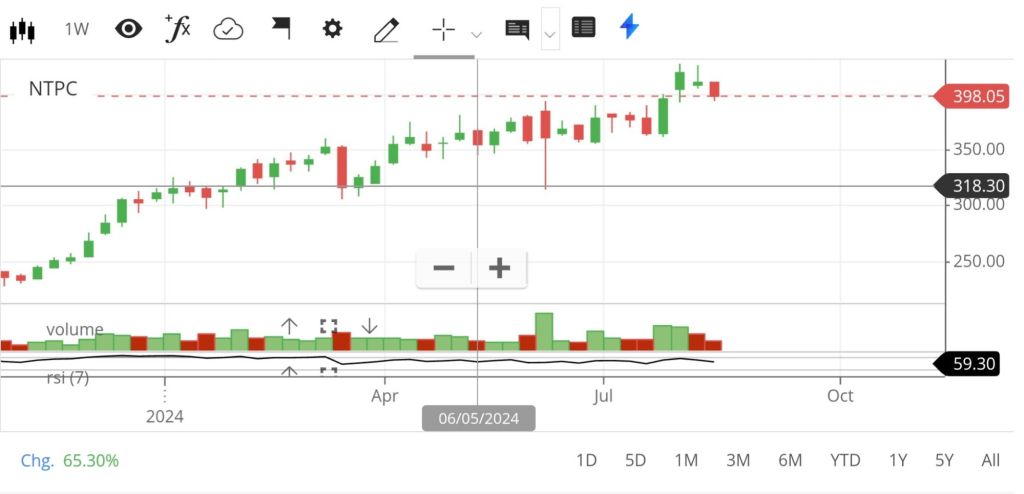
NTPC weekly chart as on 18 August 2024ONGC
Another government stock is ONGC that has made a bearish candle on weekly chart. Though it confirmation candle formation is still pending. Yes, if you check its daily chart, you’ll find a dark cloud cover candlestick pattern formation, giving a bearish signal.
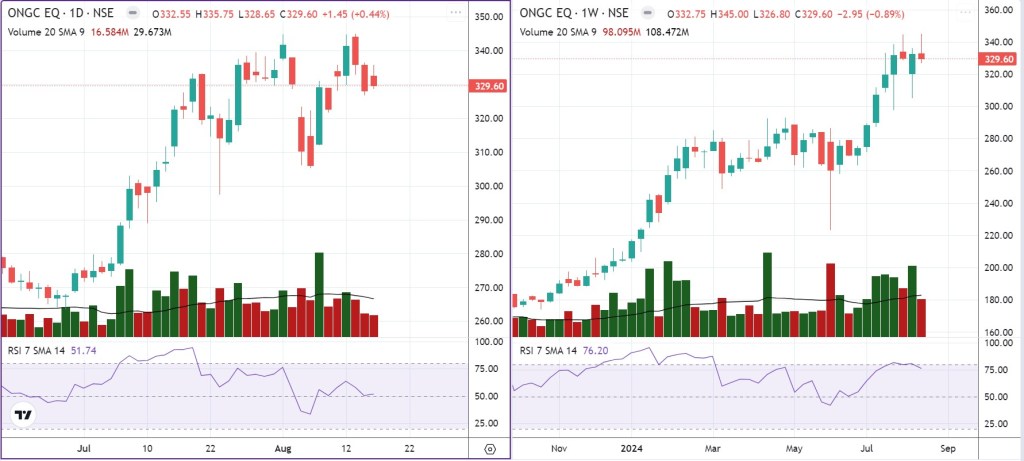
ONGC daily and Weekly charts as on 18 August 2024Closing Remarks
These bullish and bearish stock picks may provide wonderful returns in near future. However, you should not put your money in a stock just because I think that they would surge. You are advised to read our disclaimer before making a decision based on our research.
Note: We are not SEBI registered stock market advisors.


Leave a comment